First of all, to notify the computer of as much information about the financial market as possible, I added visualized volume to the pictures in the dataset.
Although I don’t think this is a bad attempt, a problem here is that the scales are sometimes different. I probably need to learn how to address pyplot more.


Now, time to force my computer to learn those 2203 pictures.

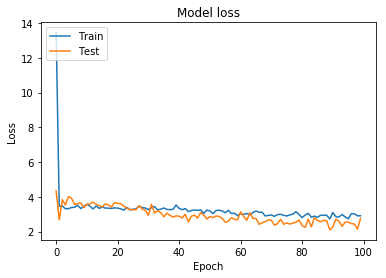
Okay, 60 epochs seem to be the best. Let’s try it again.


It seems good.

Well, the thing here is that when this model predicts, it outputs “up” with a probability of 74.64%, while in the test dataset, pictures labelled as “up” account for 66.4% of the whole dataset.
On the other hand, if the model randomly generates “up” with a probability of 74.64%, the expected accuracy is 58.07%. Therefore, 63.7% accuracy is significant or more than random decisions.
In conclusion, the model generates “Up” answers too much (74.6% of the answers are “Up”). Is this model considered to apply to practical uses? I don’t think so. There is, however, still a possibility that this model can be used as a financial recession detector. Since this model wants to generate “up” answers as much as possible, there must be something behind the decision if it generates “down” as an answer. I will try to check if it is the case by examining the result and prediction of the model further.
At the same time, it is understandable that the morel generates a lot of “Up” answers because we eliminated the financial crisis in 2007~2008 from the dataset. There has not been a severe downtrend in charts since then.
There appear to be many problems in my model and dataset, but I am willing to solve problems to make the model practical someday. See you soon.


No comments:
Post a Comment