Tuesday 31 December 2019

Slight progress


Not only am I forcing the Computer to do some machine learning but also I am making some ML approach
I have been learning about the Keras Sequential model and its layers and trying to make a better model by trying every possible combination. The problem here is that it takes several hours to process the whole dataset, which contains 3700 stock price charts from 2000-01-01 to 2019-12-31

And I got this model with 150 epochs.


250 epochs

Wait a minute, the data from around 2007 to 2009 might have much noise. Why do not we start in 2010? I will try it today and report tonight.

It seems there is a threshold of around 60%. Still targeting 75% 


After 500 epochs with small batch sizes, it reached this.


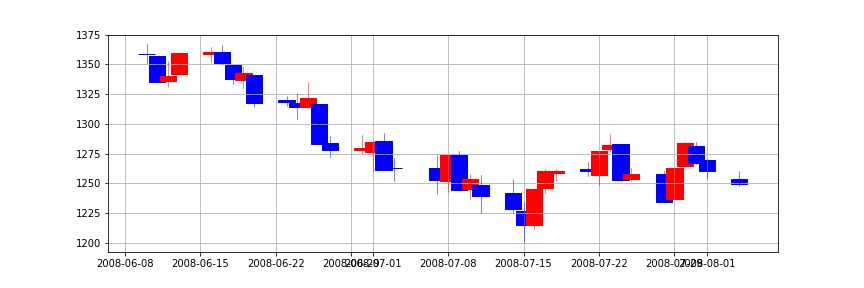
After doing another 250 epochs, it, for some reason, reached its peak and did not change the val_acc anymore. It turned out the test accuracy was 61.3% after 750 epochs. 

It might be possible that a better computer can result in better accuracy since a model with a better computational power can learn those pictures with a larger batch size without crashing. 


Monday 30 December 2019

Failure 3. Tried to improve accuracy by modifying and adding more data to the dataset.

First attempt.
I did use only drastically-up and drastically-down data to build a model this time. I got something like this. 


And in the test, we’ve got this


52% accuracy is no better than an average human.

This result indicates either, Machine learning, as far as I tested, supports that the stock market is random walking, or there is something wrong with my code or model.

The latter case is likely. I need to research further.


Second attempt.

Okay, the first one is not working. This time I will do a basic like a simple "up" and "down" analysis but this time with a more significant amount of data, including the following in a period of 2001-01-01 to today :

^N225 nikkei 225

AAPL Apple Inc.

^GSPC S%P 500

TM TOYOTA

GOOGL Alphabet Inc Class A

BA Boeing Company

AMZN Amazon.com Inc.

PYPL PayPal

TWTR Twitter, Inc.

V Visa Inc.


I got this result.


Third attempt.

In that training dataset in the second attempt, price up by even 1 or 2 cents could cause promotion from “down” to “up” and vice versa.

Data with minor price changes might confuse the algorithm. This time only price movement of 1% or more can be considered up or down. I will ignore slight changes.

Now, I got this.


I eliminated a possibly confusing factor from the dataset, and accuracy decreased for some reason.
I might have a problem with the model or layers.

In conclusion, Machine learning suggests the difficulty of predicting the stock market's future. However, it also implies that something can make the prediction possible behind the candlestick chart since 60% of accuracy is something. 


Sunday 29 December 2019

The second failure, stock price prediction attempt 2.

I, as I wrote in the last article, attempted to predict the stock market again by 1. increasing the amount of data and 2. increasing the classes by two by adding “drastically-up” and “drastically-down” to “up” and “down”.
If the price moves more than 4.8% within two months, my system will consider it a “drastic change”.

I trained the system, and I got an accuracy: of 0.36236390471458435 *100 %.
Since there are four categories, you will likely get an accuracy of around 25% if you guess randomly. Therefore, this result indicates that my model is at least more valuable than a randomized decision.

The questions here are, what does 36% mathematically mean? Is this a significant difference? It should be examined so that I can know whether or not this model is helpful in some way.

Saturday 28 December 2019

Stock price prediction is possible.


    Look at my previous article. Since the next goal was clear, I was trying to label my raw data manually one by one in the morning today, and I realized it could be done automatically with python, and I actually did it.  


    What I did

    • Classified price charts into two types, 1. One that the price went up after the period the chart shows. 2. One that the price went down after the period the chart describes. 
    • type 1(sample): promising charts   
                   
  • type 2(sample): unpromising charts 


  • I forced my computer to learn that data with the same method an AI model distinguishes between a dog and a cat.
Results 

  • In Training it reached 58% accuracy.


  • In Testing it has 55% accuracy.


What I will do next.


I will make it 75%+


After achieving it, I will upload the code to GitHub.


After the project, I will organize the whole process and explain the techniques. Stay tuned.


I can also increase the number of classes by two by adding drastically up and drastically down. 


Thursday 26 December 2019

Stock price chart clustering

What I did.


  • I got historical financial data from the pandas_datereader. This time it was S&P500
  • I made the data candlestick charts and separated them into 80 pieces of PNGs.
  • I did clustering those pictures with Keras to see if something was interesting.


Results


  • Nothing was interesting, but Keras showed its ability to do cluster analysis.


  • Keras made 49 labels.

Labels that contain three or more price charts will be shown below.


label 5 ▽


label 9 ▽


label 15 ▽


label 18 ▽


label 23 ▽


label 27 ▽


label 36 ▽


Possible usage of this clustering in the future

 This approach could be helpful if those pictures had labels of future price movement as some form of "answer". And I have the data, which is the equivalent of the "answer" data. The future price can be predicted when the specific pattern, that is pretty common before the price hikes, appears. That is theoretically possible with my hands now, but I want it done automatically.


Next milestone.

 After clustering, we call answer pictures to compare and see whether or not the clustered patterns are firm.


reference
複数画像をKerasのVGG16で特徴抽出してk-means++でクラスタリング - test.py http://testpy.hatenablog.com/entry/2017/07/22/195400

Market Prediction with Artificial Intelligence. Demonstration.

          We finally managed to actualise what We wanted to make.            We developed A model that can predict the stock market and auto...