Saturday 18 January 2020

Planning. Again

Okay, we’ve faced numerous problems.
I was planning to make the best AI with many attempts. There, however, might be a better way to enhance the result of the prediction.

The method is easy. First, create several better models with different layers and data. The number of AIs is ideally odd.
Then take a vote amongst the better AIs to decide a final prediction on the market.

A problem or difficulty I can consider is that the chosen AIs should probably be diversified. Therefore, the next plan is to build several numbers of quality AIs with different data.

Wednesday 8 January 2020

Considering the practicality

First of all, to notify the computer of as much information about the financial market as possible, I added visualized volume to the pictures in the dataset.
Although I don’t think this is a bad attempt, a problem here is that the scales are sometimes different. I probably need to learn how to address pyplot more.


Now, time to force my computer to learn those 2203 pictures.


Okay, 60 epochs seem to be the best. Let’s try it again.


It seems good.


Well, the thing here is that when this model predicts, it outputs “up” with a probability of 74.64%, while in the test dataset, pictures labelled as “up” account for 66.4% of the whole dataset.
On the other hand, if the model randomly generates “up” with a probability of 74.64%, the expected accuracy is 58.07%. Therefore, 63.7% accuracy is significant or more than random decisions.

In conclusion, the model generates “Up” answers too much (74.6% of the answers are “Up”). Is this model considered to apply to practical uses? I don’t think so. There is, however, still a possibility that this model can be used as a financial recession detector. Since this model wants to generate “up” answers as much as possible, there must be something behind the decision if it generates “down” as an answer. I will try to check if it is the case by examining the result and prediction of the model further.
At the same time, it is understandable that the morel generates a lot of “Up” answers because we eliminated the financial crisis in 2007~2008 from the dataset. There has not been a severe downtrend in charts since then. 

There appear to be many problems in my model and dataset, but I am willing to solve problems to make the model practical someday. See you soon.

Sunday 5 January 2020

Planning phase

Allow me to write a few words before the central part.

I recapped what I wrote here and published it on a Japanese website where Japanese coders gather. Thankfully, many people read the article. I am pleased about this. Thank you very much.  


Plan


Okay, we did everything we could easily do.

The question here is, what should we do to improve this model and make it more practical?

 There are mainly two ideas now.

1. To put another indicator on pictures in the dataset.

Ex) long-term trend and trading volume information.

2. To test several models automatically and save only the best result (This will save possibly one with the highest accuracy.)

Problem 1. 67% of the data was labelled as “Up” in the dataset. My computer might think to answer “up” a lot is the solution for enhancing its accuracy.


Well no. First, the computer is not headed to maximize accuracy but to minimize the loss function.


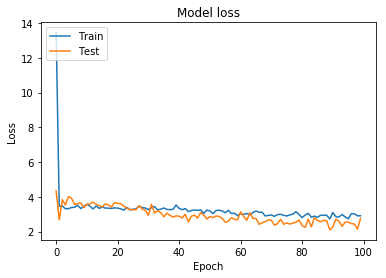
Reference 1. I made the ratio of “Up” and “Down” in dataset 1:1 by eliminating some of the “Up” pictures, and we’ve got the following result after 75 epochs.  


Although this does not deny the possibility that the imbalance in the dataset might affect the resulted accuracy, this result indicates that this model is much more than a random pick.  

Reference 2.

"Up" accounts for n(former)% of the whole dataset * AI answers "Up" with a chance of n(latter)%. The expected accuracy of AI completely randomly generates answers.

If the “Up” accounts for 70% of the dataset and AI randomly generates “Up” with a 60% or 70% chance. Accuracy will be around 54% or 58% each. Therefore, I can say that 64% or even 60% can be considered significant. In other words, it is more than a random coincidence. 
Since I do not know probability theory very well, I let python calculate the probability for me with the codes below.  


Problem 2. Since it is a significantly simplified model, the only function is to predict the price precisely two months later, and it does not consider the price fluctuation during the period at all. Practical operation with this model might be too dangerous.

I can solve this problem by improving the model and idea step by step. See you soon.


Market Prediction with Artificial Intelligence. Demonstration.

          We finally managed to actualise what We wanted to make.            We developed A model that can predict the stock market and auto...