What I did.
- I got historical financial data from the pandas_datereader. This time it was S&P500
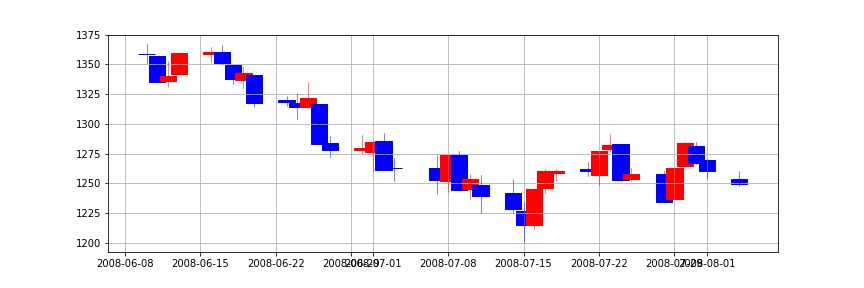
- I made the data candlestick charts and separated them into 80 pieces of PNGs.
- I did clustering those pictures with Keras to see if something was interesting.
Results
- Nothing was interesting, but Keras showed its ability to do cluster analysis.
- Keras made 49 labels.
Labels that contain three or more price charts will be shown below.
label 5 ▽


label 9 ▽


label 15 ▽


label 18 ▽


label 23 ▽


label 27 ▽


label 36 ▽


Possible usage of this clustering in the future
This approach could be helpful if those pictures had labels of future price movement as some form of "answer". And I have the data, which is the equivalent of the "answer" data. The future price can be predicted when the specific pattern, that is pretty common before the price hikes, appears. That is theoretically possible with my hands now, but I want it done automatically.
Next milestone.
After clustering, we call answer pictures to compare and see whether or not the clustered patterns are firm.
reference
複数画像をKerasのVGG16で特徴抽出してk-means++でクラスタリング - test.py http://testpy.hatenablog.com/entry/2017/07/22/195400


No comments:
Post a Comment